Index of sustainable accessibility to sports and outdoors facilities
JORGE GIL & SUSAN RUINAARD
Introduction
It is becoming increasingly important that people have regular physical activity and have easy access to recreation, relaxation and exercise for their well-being and general health. Many people are, or feel, dependent on the car to engage in such sports and outdoor activities, to make the everyday puzzle work. This is due to the long travel times or inability to reach those activities by any other means at the required time. Either because sustainable alternatives, such as cycling infrastructure or public transport, are not available where they live, or the activities are located in distant places with limited transport alternatives. Considering the global ambition to reduce carbon dioxide emissions from the transport sector, which accounts for approximately one third of total emissions, and knowing that non-work or school travel accounts for around 50% of our journeys, this leads to an unsustainable situation.
Currently, a growing number among academics and practitioners advocate that the goal of transportation policies should be to improve people’s access to daily activities, changing the focus from mobility to accessibility. A simple definition of accessibility is ’the ease in which people can reach places and opportunities’, where opportunities refer to jobs, health care, education, leisure activities, among others (Pereira & Herszenhut, 2023). This implies developing policies that bring people and activities closer together and promote the integration between transport and land-use planning.
Municipalities require knowledge about the accessibility of their residents to sports and outdoor recreation activities to inform their comprehensive plans (Översiktsplan in Sweden). To gain this knowledge, there is a need for detailed baseline information on several levels: where people live, where they participate in sports and outdoor activities, and the transportation network and services connecting these locations. By combining and analyzing this information, both transport and land use planning can strategically provide sustainable transport alternatives to meet the needs and practices of residents.
What is accessibility?
The concept of accessibility has evolved across different disciplines and applications, which resulted in accessibility being measured in different ways. The four different perspectives on accessibility identified by Geurs & Van Wee (2004), are:
- Infrastructure-based accessibility – measures the performance of the transport infrastructure (e.g., congestion and average speed).
- Location-based accessibility – measures the access from locations to spatially distributed opportunities (e.g. number of jobs within 30 minutes).
- Person-based accessibility – measures access at the individual level (e.g. activities that an individual can participate in at a given time).
- Utility-based accessibility – measures the (economic) benefits that individuals derive from access to spatially distributed opportunities, based on their preferences.
In every perspective, the elements of accessibility are the land use patterns (i.e., the spatial distribution of people, activities, and opportunities), and the costs of travel (e.g., travel time, trip distance, monetary cost) over the transport infrastructure that connects everything. However, person- and utilty-based accessibility measures require detailed information on individuals and their preferences, making them more difficult to implement.
In integrated transport and land use planning, location-based accessibility is the most used, and its simplest measures are (Pereira & Herszenhut, 2023):
- Minimum travel cost – indicates the ease of travel to reach the nearest opportunity from a given location. For example, the travel time from a residential location to the closest swimming pool. This is simple to calculate but does not consider the number of opportunities.
- Cumulative opportunities – captures the number of opportunities that can be reached within a given travel cost limit. For example, the number of gyms accessible from a residential location within 30 minutes. This is also simple to calculate and can account for the number and diversity of opportunities.
Other accessibility measures consider the competition for opportunities, use a distance decay function instead of a single travel cost limit, or account for the desirability or attraction of different opportunities. However, these require more data, are more difficult to calculate, and become more difficult to interpret.
Measuring sustainable accessibility to sports and outdoors in Sweden
In the context of measuring accessibility to sports and outdoors facilities by different transport modes (i.e. walking, cycling, public transport and car), with the aim of informing sustainable transport and land use planning in municipalities, the simpler measures of location-based accessibility are a suitable starting point to answer these key questions:
- What is the shortest travel time to the nearest facility of an activity, by each mode?
- How many different activities are within reach, by each mode?
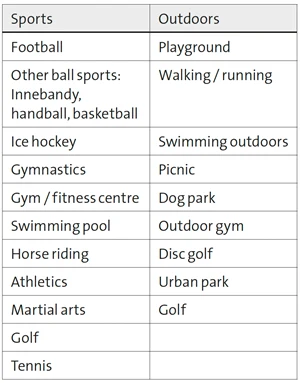
In sustainable accessibility to sports and outdoors one should consider the most common “everyday” activities, within or outside associations, covering all ages and genders, which will generate most trips. The most common activities amongst the Swedish population (Riksidrottsförbundet, 2011; Fredman et al., 2019; Beijar, 2014) are summarised in Table 1.
Table 1 – Most practiced sports and outdoors activities of the Swedish population.
Furthermore, people should have access to these activities from where they live within a reasonable time (i.e. a maximum of 30 minutes), and by choosing a sustainable transport mode over the car (i.e. walking, cycling or public transport).
One could consider different travel times for the different activities and for the different transport modes. However, this would require information on individual preferences and behaviours, it would result in a very large number of unique accessibility analyses, and the results would be hard to assess and compare. To communicate the results in a simple and useful way, we keep the accessibility analyses comparable across all activities and modes and develop a composite index that is presented in a single map.
The general work-flow for measuring accessibility and producing the index is illustrated in Figure 1, and includes four tasks: data preparation, accessibility analysis, index calculation, and communication.
The first task of data preparation is an important prerequisite for the subsequent analyses, influencing their scope and accuracy, and requires a considerable effort. The second task of accessibility analysis results in many indicators for all possible combinations of activities and travel modes. To communicate these indicators (task four) one must select how to visualize them meaningfully, and how to combine them to reduce complexity. Task three’s main purpose is also simplification, by aggregating the multiple indicators into an index that provides an overview of sustainable accessibility.
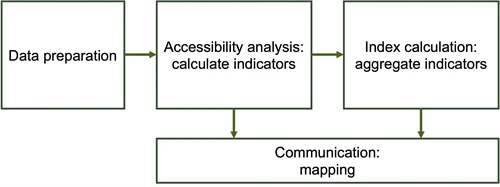
Figure 1 – The four tasks of the workflow for measuring accessibility and producing an index of sustainable accessibility to everyday sports and outdoors.
It all starts with data
To measure sustainable accessibility to sports and outdoors one needs to collect and prepare three types of data inputs, in this case:
- Origins – residential locations
- Destinations – sports and outdoors facilities
- Transport networks – for different modes, including public transport timetables
These data inputs can be obtained from different data sources (see examples in the fact box), and in most cases they require some data preparation to extract only the relevant information for input to the accessibility analysis (Figure 2).
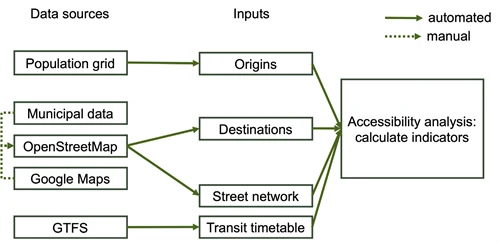
Figure 2 – Data preparation process for measuring sustainable accessibility.
The origins are the simplest input to prepare, as it only requires the geographic coordinates of the data chosen to represent the resident population and optionally the population total. In the following analyses we have used the 100m population grid of Sweden from SCB. Figure 3a shows the origins for Lilla Edet municipality.
The destinations, on the other hand, require considerable preparation work because there is no single national database of sports and outdoors facilities of all the required categories (see Table 1). Such information is scattered across different agencies, and the municipalities only have databases of the facilities that they are responsible for. Global databases from OpenStreetMap or Google Maps provide important complementary information for commercial facilities, but they can be incomplete, inconsistent, and outdated. Furthermore, each data provider uses its own convention for data storage and for classifying facilities, making them hard to combine.
For all these reasons we follow a data preparation workflow with three steps. First, we identify the most suitable data source for the different categories. Second, we collect the data from each source and update the public OpenStreetMap database with additional facilities. We opt for this database because it is open access and globally available and follows a simple standard that covers all types of facilities. Finally, we select and reclassify the destinations to match our categories, producing a simple input file with coordinates of each facility and its category.
Figure 3b shows the destinations for football activity to use in accessibility analysis of Lilla Edet municipality, taken from the entire destinations file. The destinations file contains facilities that exist within a 25 km distance to the municipal boundary, because these facilities can be the nearest facility within a 30-minute journey for residents living close to the borders of the municipality.
The transport network requires minimal preparation, depending on the analysis tool being used. The goal is to obtain a street network that represents paths available for walking, cycling and driving, plus stops and timetables for public transport journeys. In this case we adopted the r5py accessibility analysis tool (https://r5py.readthedocs.io/en/stable/) that takes as input OpenStreetMap and GTFS files directly. The only requirement was to clip the OpenStreetMap data for the relevant region, i.e. Västra Götaland and Uppsala län, to create smaller street networks that the tool can handle.
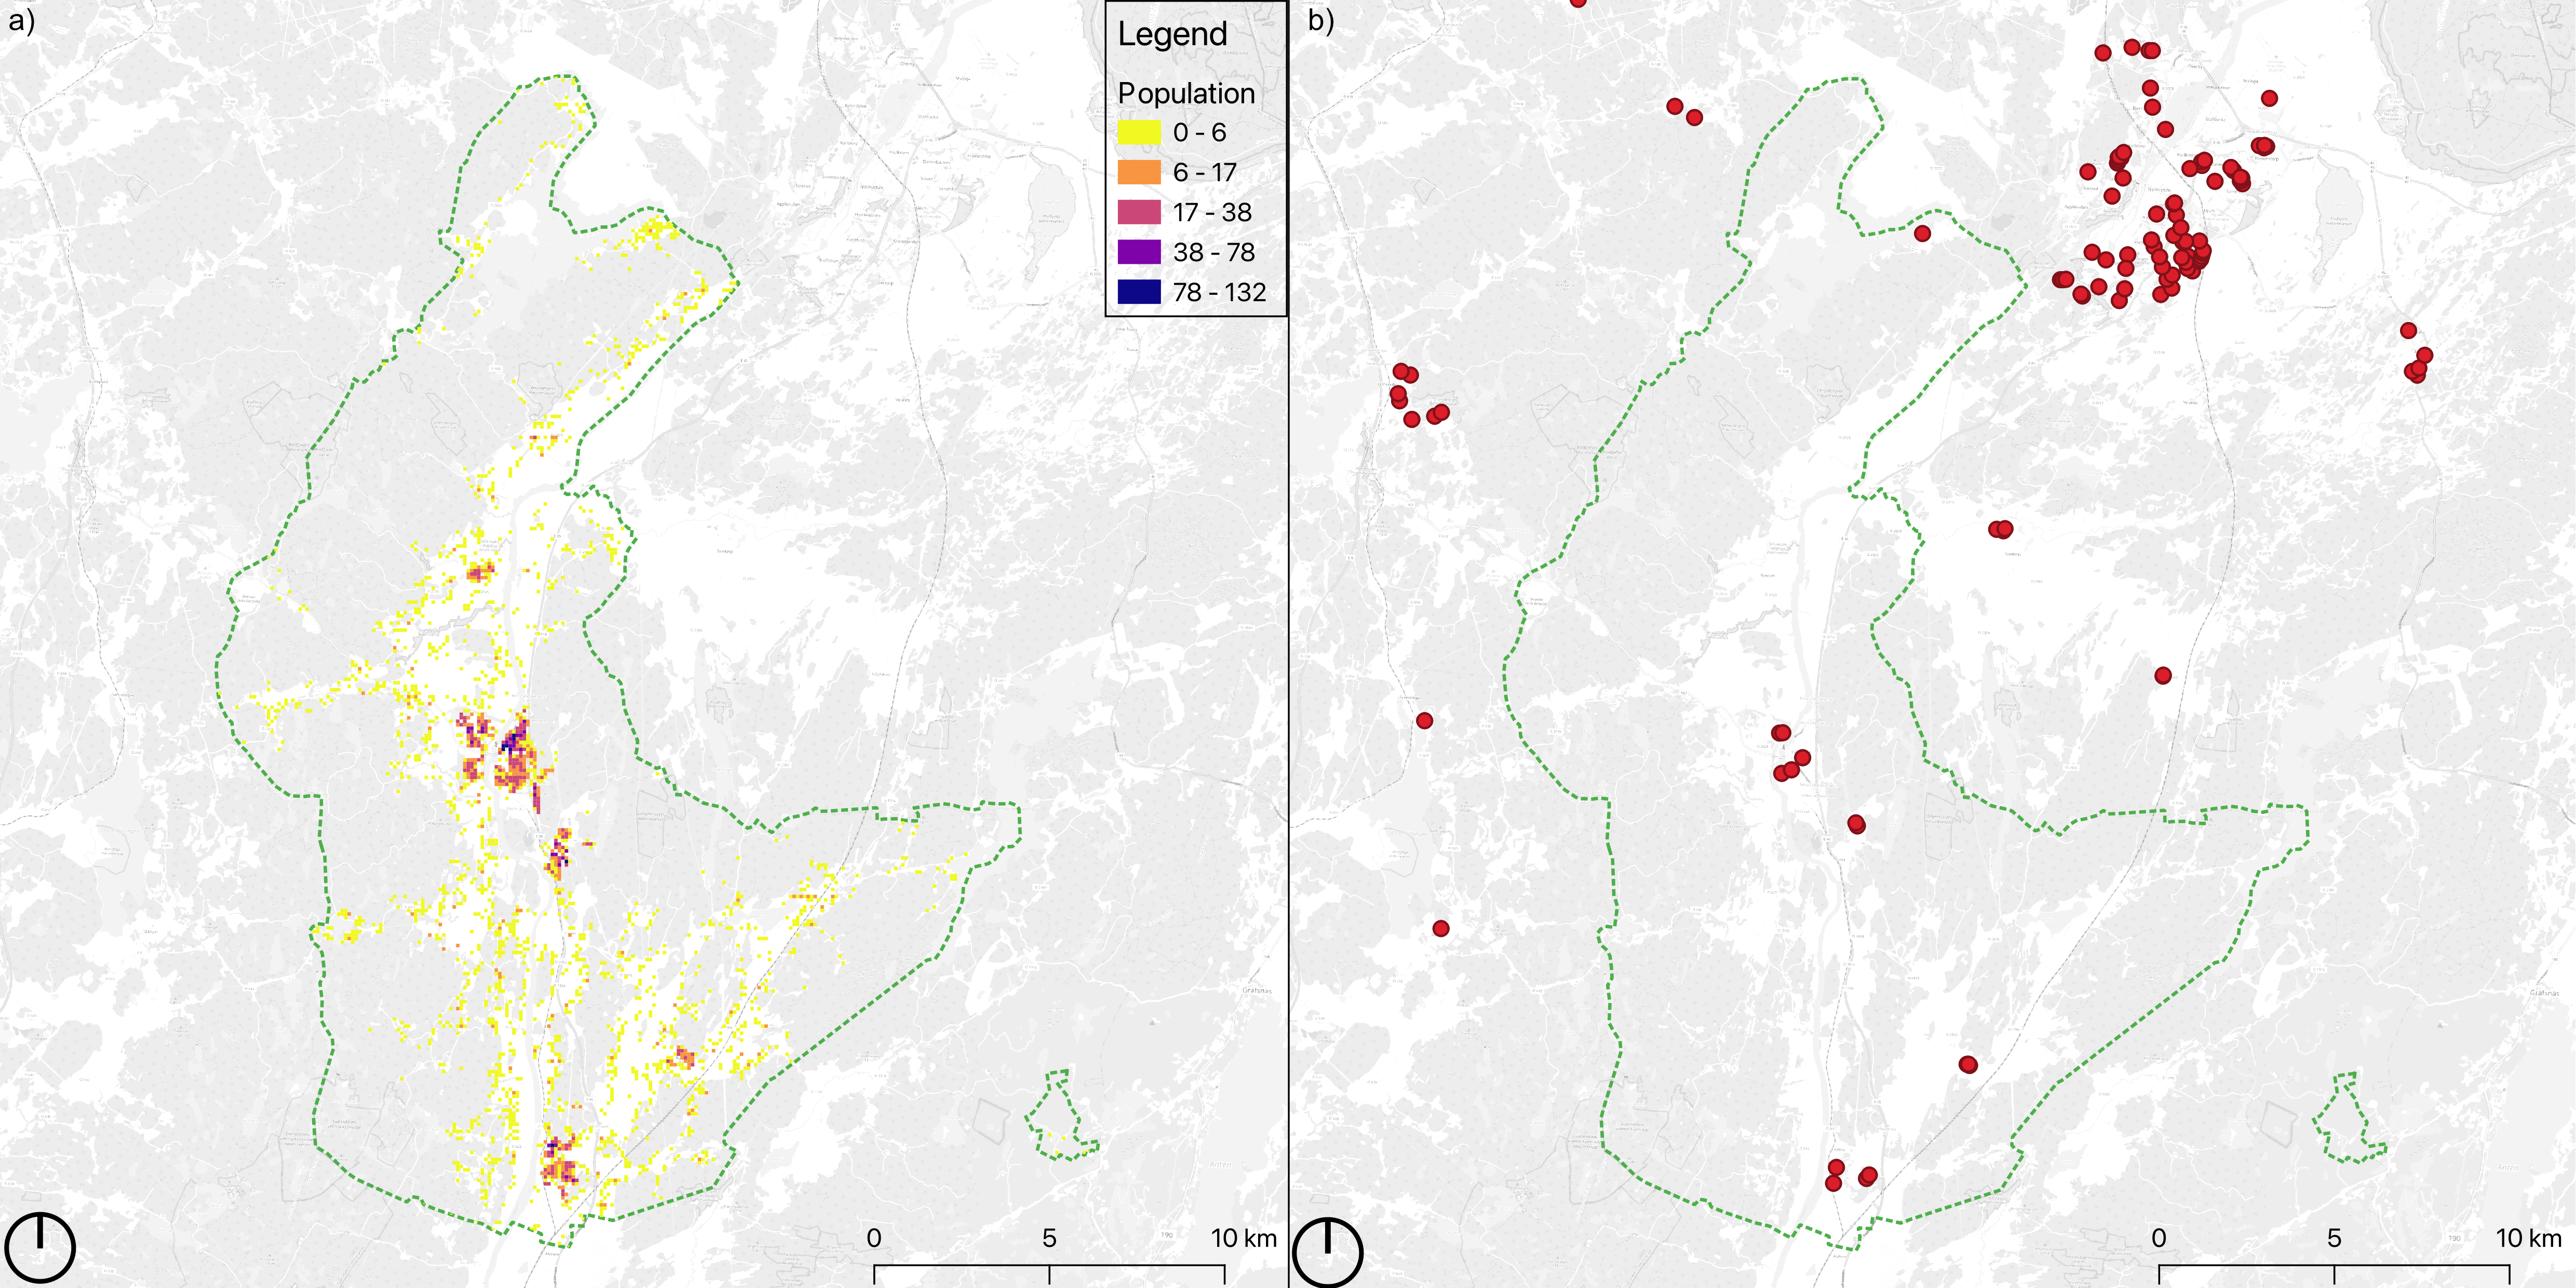
Figure 3 – Maps of Lilla Edet municipality, a) origins (poulation), and b) destinations (football pitches), for accessibility analysis
Data sources for Sweden
Origins
- SCB population grids - https://www.scb.se/vara-tjanster/oppna-data/oppna-geodata/statistik-pa-rutor/
- Municipal address points
Destinations
- Municipal databases
- OpenStreetMap points of interest (POI), can be obtained from Geofabrik - https://download.geofabrik.de/europe/sweden.html
- Google maps - https://www.google.com/maps
Transport networks
- OpenStreetMap road network (includes pedestrian and cycling paths), can be obtained from Geofabrik - https://download.geofabrik.de/europe/sweden.html
- Trafikverket road and bicycle network - https://www.trafikverket.se/e-tjanster/hamta-data-fran-trafikverket/
- Trafiklab GTFS Sverige 2 https://www.trafiklab.se/api/trafiklab-apis/gtfs-sverige-2/
Analyzing accessibility by different modes
As described earlier, the accessibility indicator to calculate is the shortest travel time from each origin to the nearest activity of each category by the different travel modes: walking, cycling, public transport and car. This indicator improves interpretability and simplifies the analysis task by treating all activities equally. Activities have different usage and location patterns: football is widely available in every locality; ice hockey rinks are few and exist only in some localities; horse riding facilities are few and concentrated in specific rural locations; and golf courses are also few and usually found in rural locations. The minimum travel time gives a unified measure of the quality of all the available activities.
As an example, we present the accessibility to football pitches in the Lilla Edet municipality by different transport modes (Figure 4).
From these analyses it becomes clear that the car has overall reach to all facility types in the shortest time, even if in some cases, not within the 30 minutes travel budget. On the other hand, the sustainable travel modes offer different possibilities:
- Walking is very local and efficient for local activities; however, many locations do not offer a wide range of activities.
- Cycling increases the reach and offers overall access to activities at the city scale.
- Public transport is less flexible, can result longer travel time over short distances, but provide access to locations over longer distances.
The choice of different travel modes depends on the person’s preferences, including comfort, safety, convenience, among others, and what one derives the highest utility from, which is largely affected by travel time. Based on the sustainable travel options available, one chooses the mode that derives the highest utility for each activity. Based on this principle, we also calculate a sustainable accessibility indicator with the shortest travel time by any of the sustainable modes (Figure 5), that can be compared against the car. Combined, the sustainable mode choices offer a level of accessibility that approximates the car, depending on the specific activities and the rurality of the location.
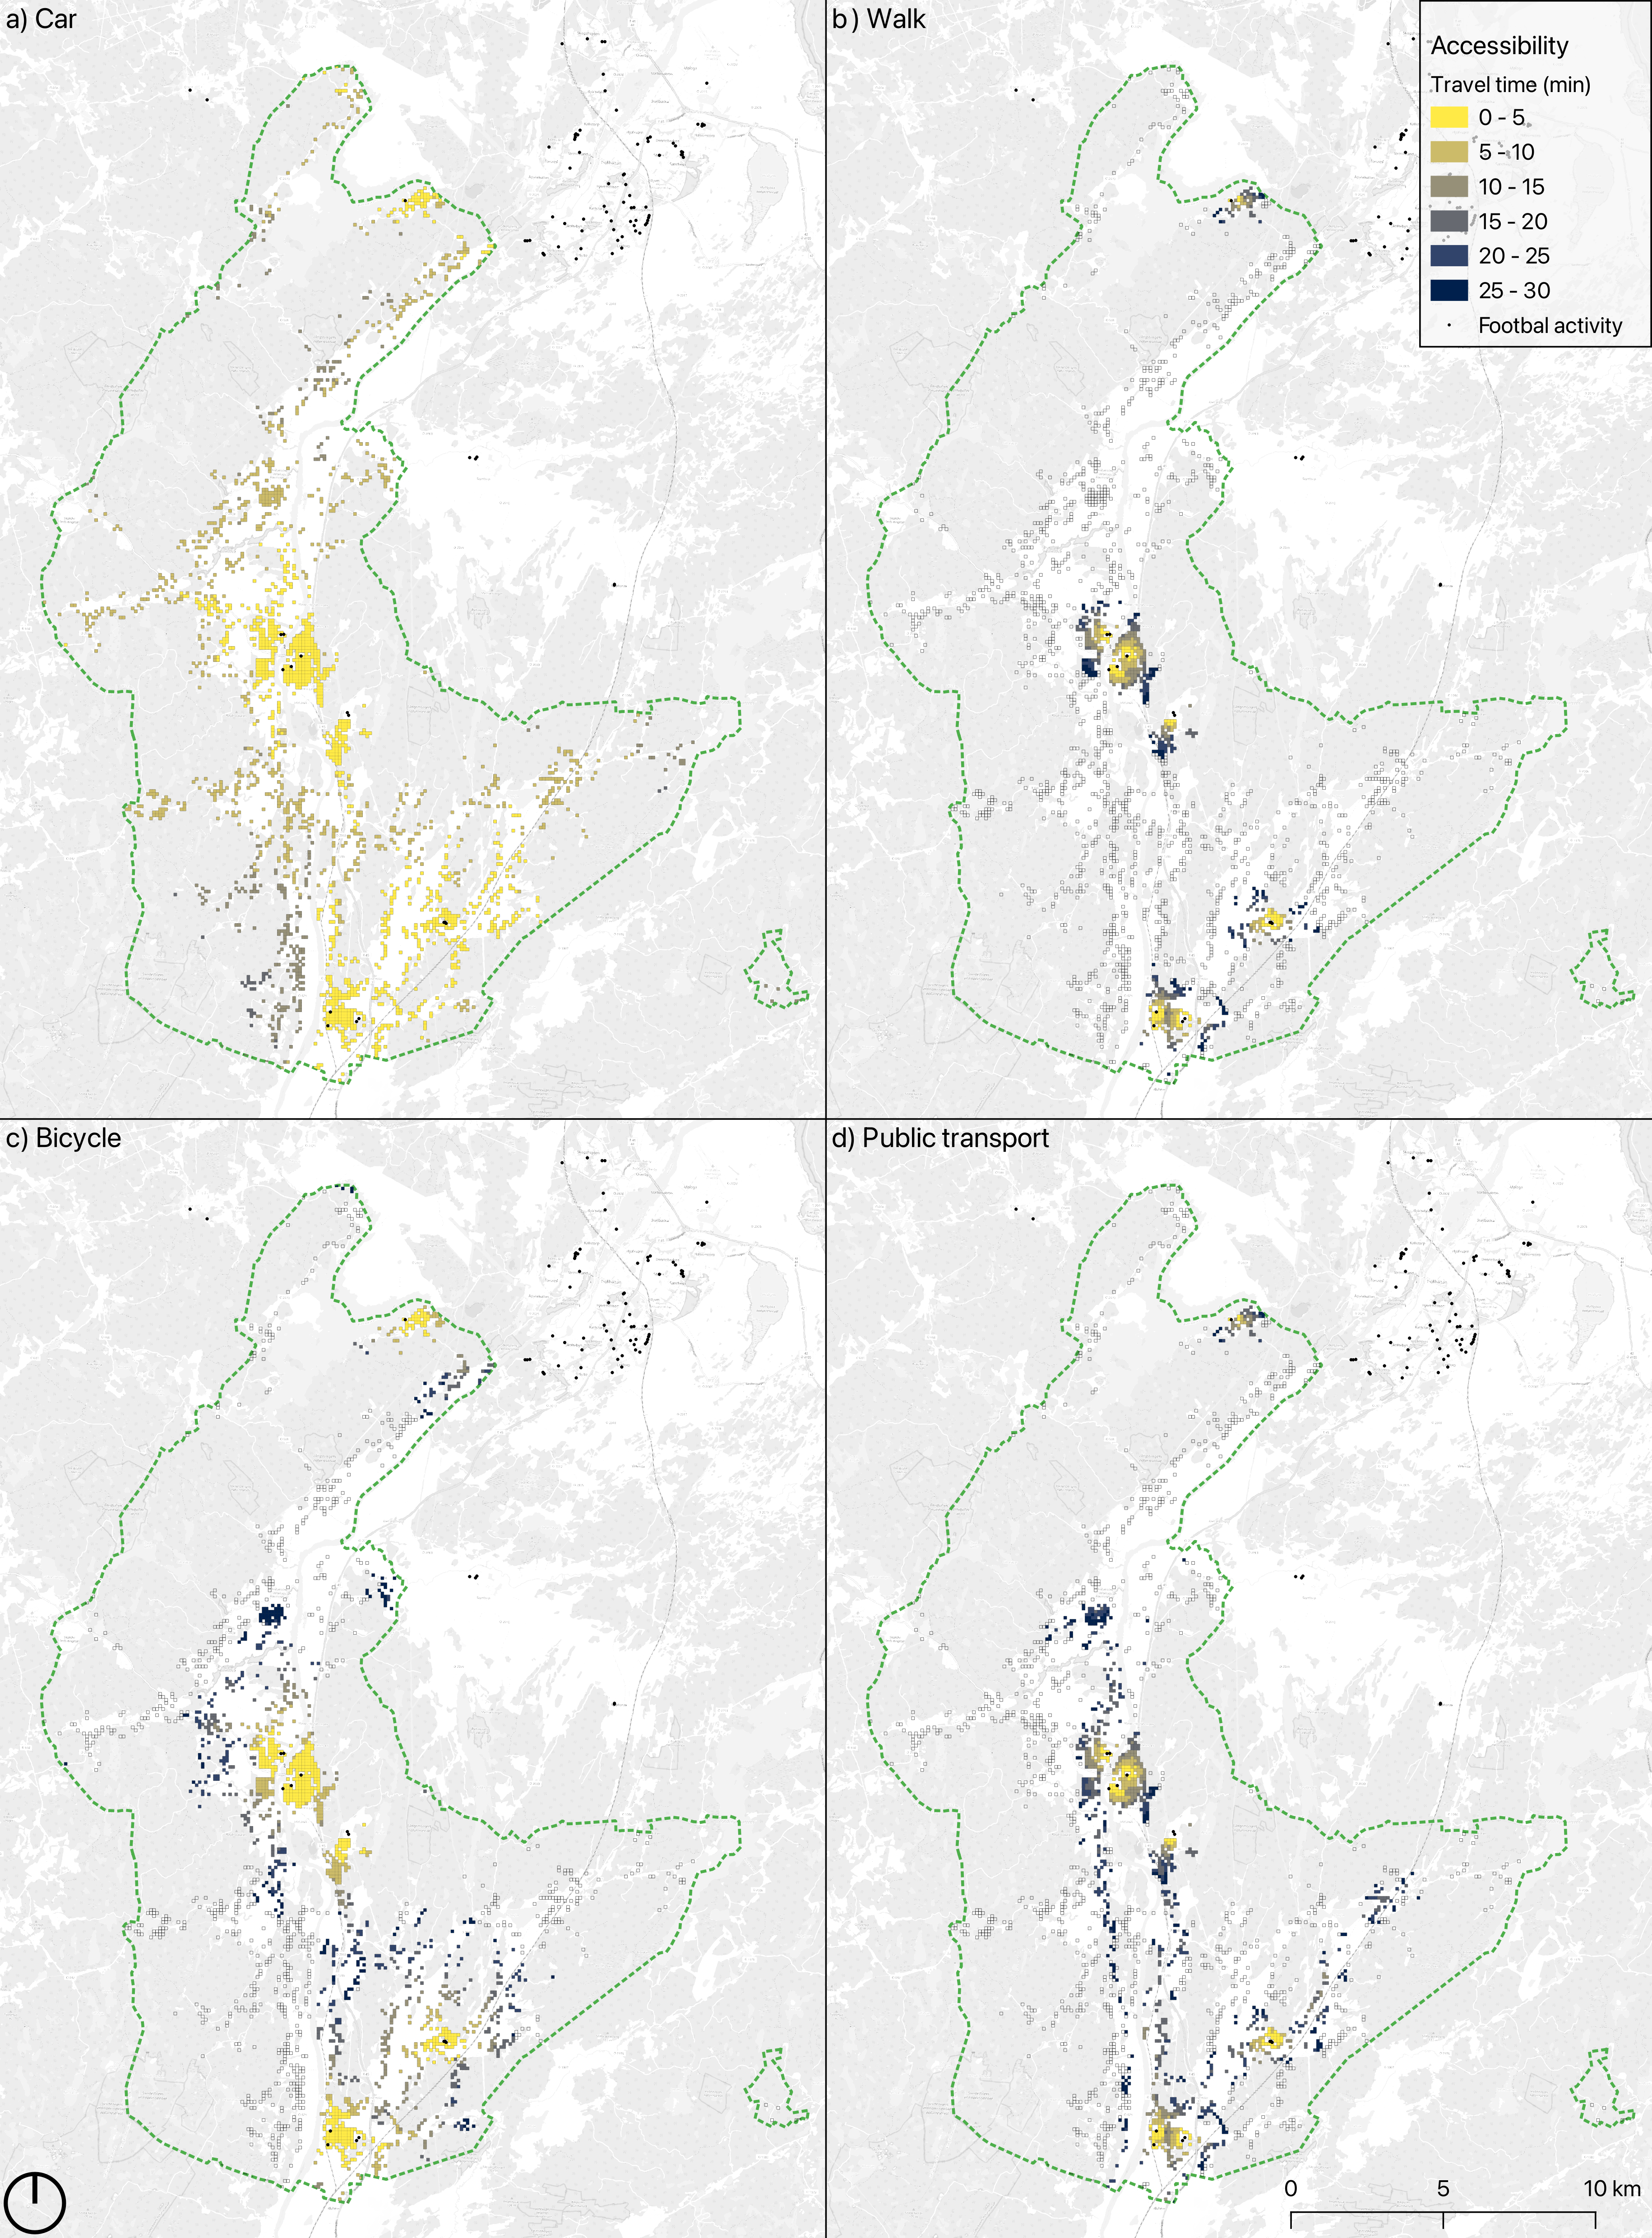
Figure 4 – Accessibility to football (shortest travel time) by car, walking, cycling and public transport in Lilla Edet municipality.

Figure 5 – Accessibility to football (shortest travel time) by sustainable modes in Lilla Edet municipality.
Tools for accessibility analysis
- R5R (https://ipeagit.github.io/r5r/) or R5py (https://r5py.readthedocs.io/en/stable/)
- QGIS (https://www.qgis.org/en/site/)
- Place Syntax plugin (https://smog.chalmers.se/projects/pst-plugin-for-qgis/)
- ArcGIS Pro (https://pro.arcgis.com/en/pro-app/latest/tool-reference/spatial-analyst/distance-accumulation.htm)
- PTV Visum (https://www.ptvgroup.com/en/application-areas/accessibility-analysis)
Index of sustainable accessibility
While the sustainable accessibility indicators provide a detailed understanding of the provision of individual sports and outdoors activities to the population, by different travel modes, it results in a large number of analyses and maps. A necessary task, to facilitate understanding and communication of the results, is to aggregate these analyses in a more concise index of sustainable accessibility. The first step is to capture the variety of activities accessible by car and sustainable modes separately, considering each origin, by calculating how many different activities can be reached within the 30 minute travel time limit. This reduces the results to one map per mode. The second step is to calculate the percent of different activities accessible by sustainable modes, in relation to those accessible by car. Considering that by car one can always reach more activities, this composite index gives a maximum score of 100% if all different activities reached by car, can also be reached by a sustainable mode in a reasonable amount of time (maximum 30 minutes). The results for Lilla Edet can be seen in Figure 6.
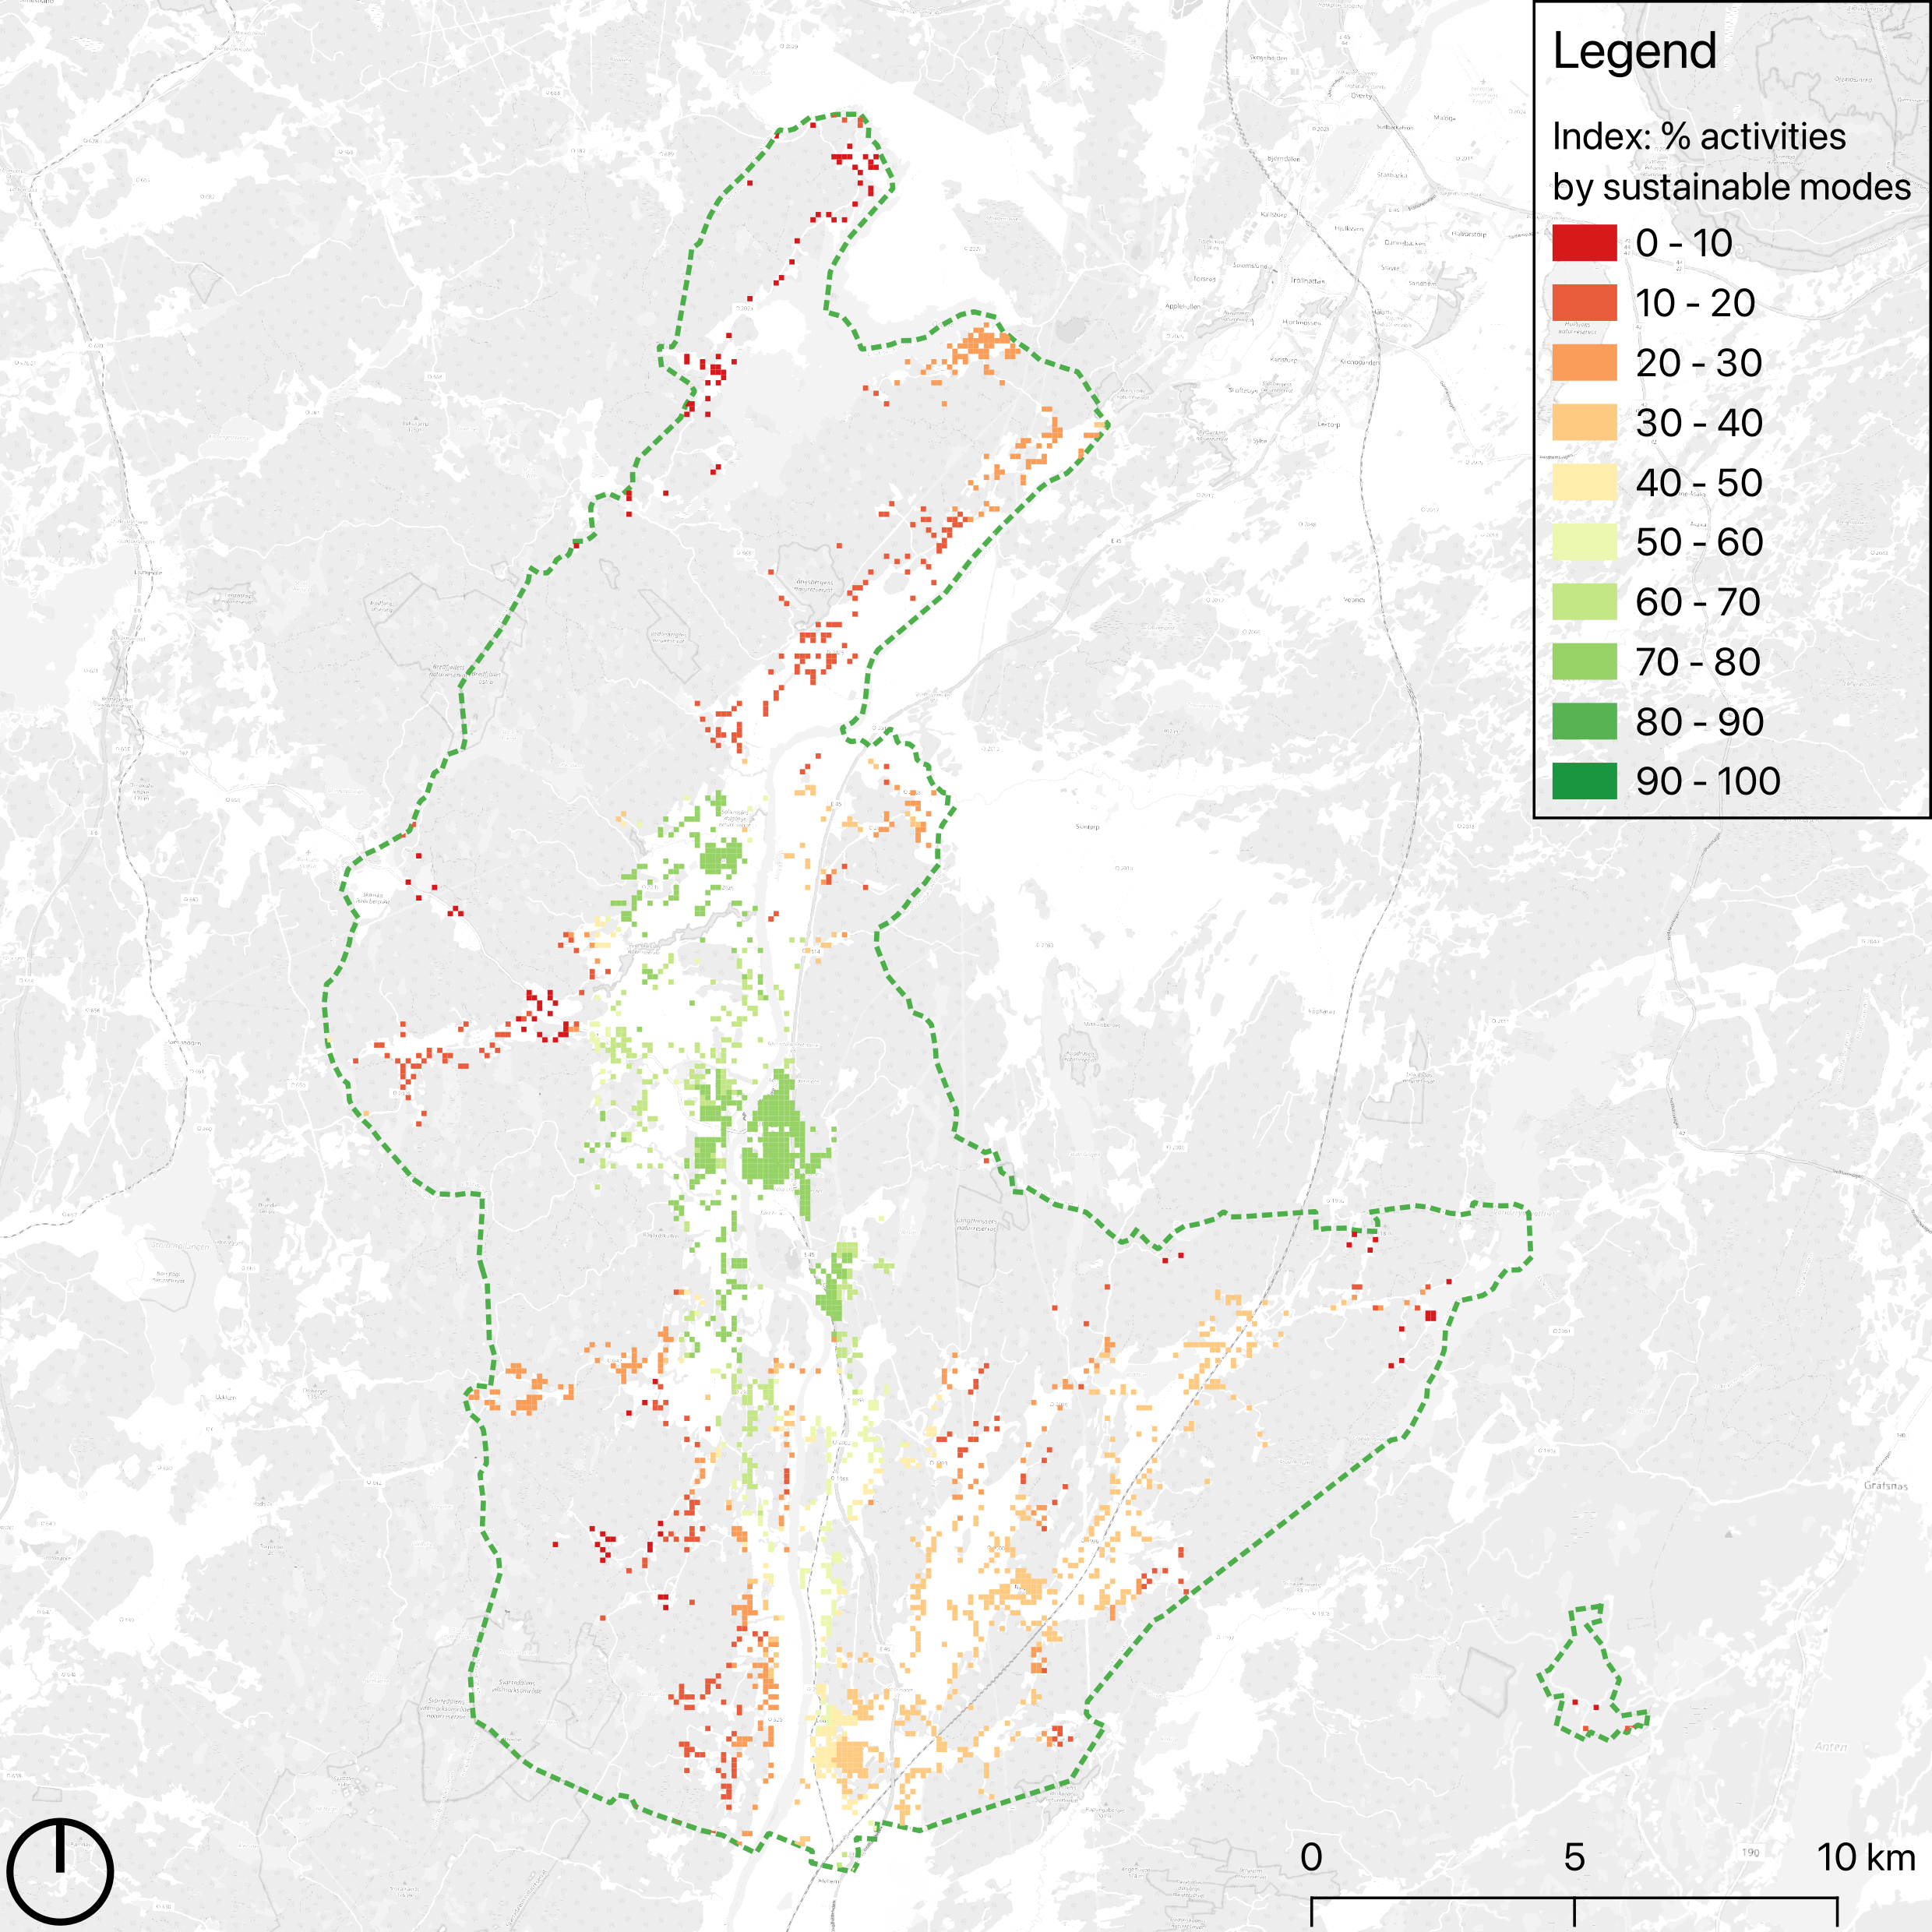
Figure 6 – Percent of sports and outdoors activities accessible by sustainable transport, compared to the car.
In general, sustainable travel modes cannot offer the same diversity of access to sports and outdoors activities as the car. In larger urban areas the diversity of activities is nearly the same thanks to the higher concentration and diversity of sports activities. In smaller towns one has access to 50-80% of the activities that one can reach by car. However, in rural areas one has access to less than 20% of distinct activities by using sustainable travel modes.
Because the nature and spatial distribution of sports and outdoors activities is so distinct, we also calculate the index separately for each category, sports versus outdoors (Figure 7a & 7b). While sports activities are mostly concentrated in and around urban agglomerations, thus providing the highest sustainable accessibility index score in urban areas, outdoors activities, in particular walking / running, are distributed across the landscape, thus providing a higher sustainable accessibility index score in suburban areas and a less negative score in rural locations, while in the larger urban cores the index drops some levels.
Smarter planning and decision making
The accessibility analyses and index here presented can help draw insights on the sustainable accessibility of sports and outdoors afacilities in a given municipality, showing which activities are available to the population, and if they can be reached by sustainable transport means within a reasonable travel time (30 minutes). From an environmental perspective, some sport types are within reach of most people by sustainable means (e.g. football), while other sports not so much (e.g. golf). From a social and public health perspectives, some sport and outdoors activities have locations that exclude a large part of the population, while others require an increased travel time. Effective policies must also address other factors, such as comfort, safety, and convenience, by enhancing the transport system for sustainable modes.
From these insights, what can municipalities do? Spatial planning can directly and indirectly influence the various levels of the challenge of providing sustainable accessibility to everyday sports and outdoors, by:
- Deciding or regulating the location of facilities (destinations)
- Planning the location of new housing (origins)
- Improving cycling infrastructure (travel mode)
- Providing targeted public transport services (travel mode)
- Supporting car sharing (travel mode)
On a more general level, municipalities can contribute to solving this challenge by maintaining or contributing to complete and up-to-date databases on the different types of activities and destinations.
The method here presented represents a digital support tool for smarter planning and decision making. The challenge is complex and there are no “one size fits all” solutions, given that every type of sports facility, outdoors activity, and municipality through its population and geography poses different requirements and conditions.
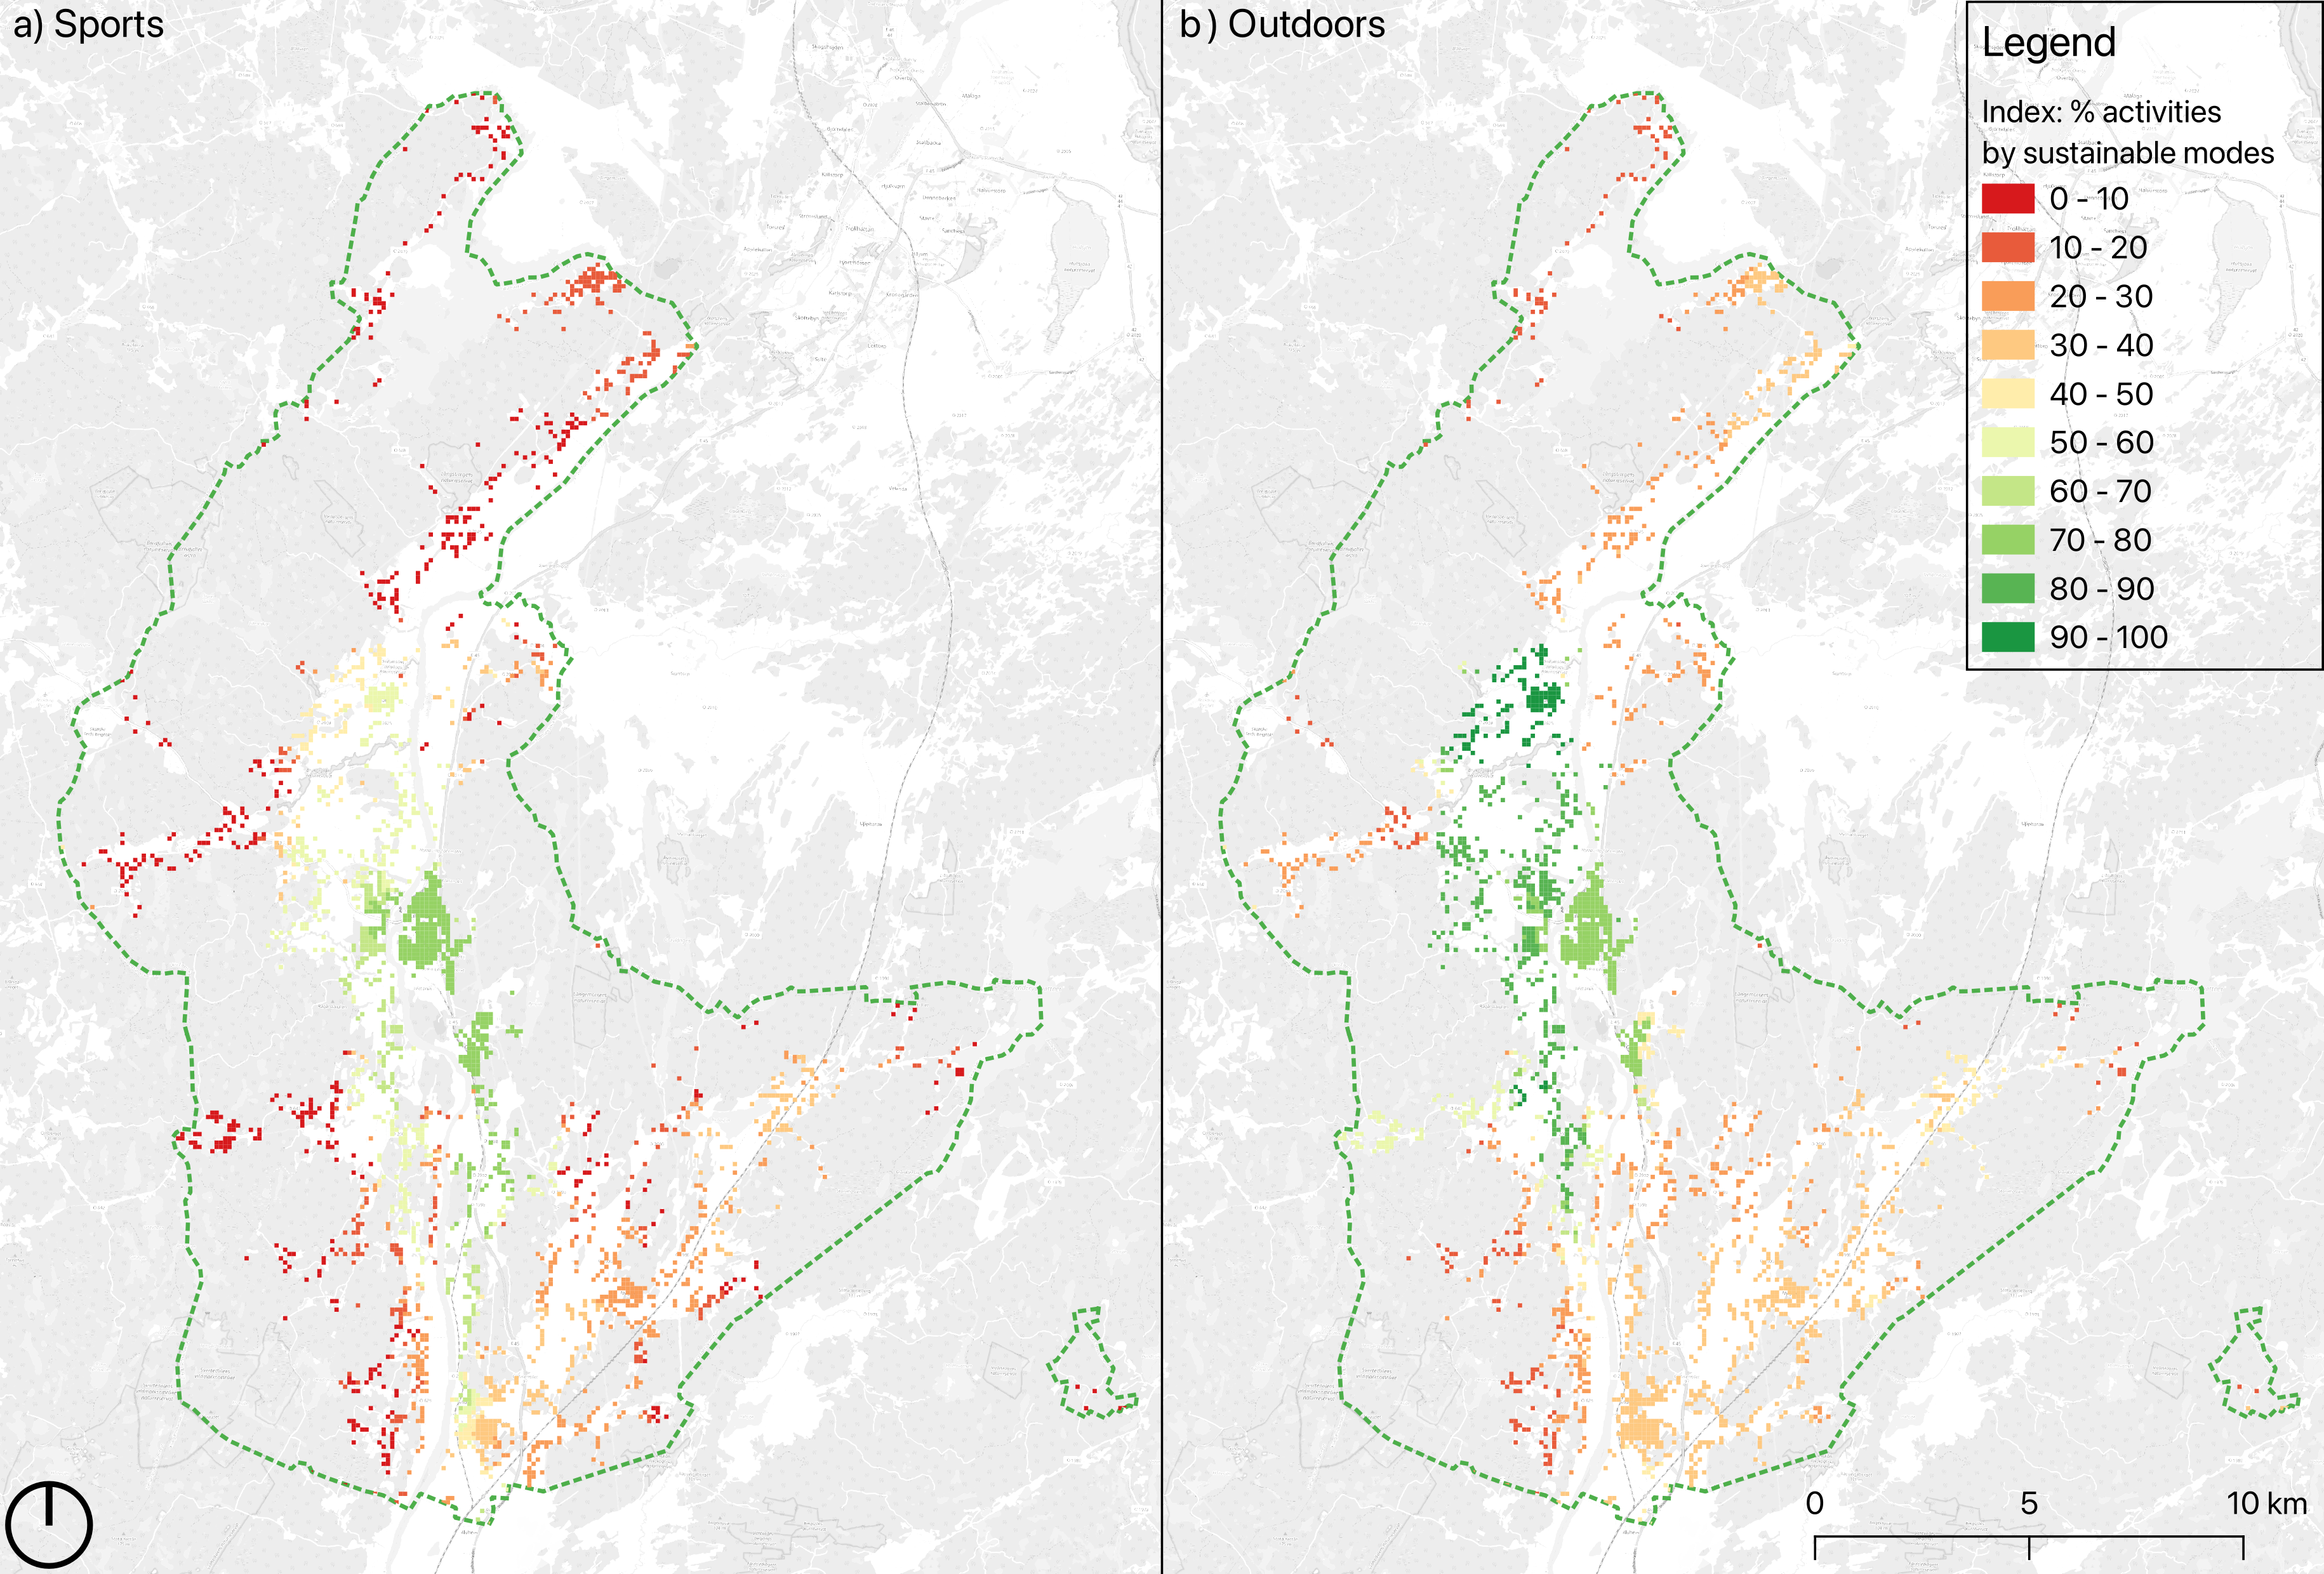
Figure 7 – Percent of sports versus outdoors activities accessible by sustainable transport, compared to the car.
References
Beijar, Per. (2014). Idrottsvanor Bland Ungdomar - En Kartläggning Över Föreningsidrott och Spontanidrott. Master thesis, Umeå universitet. https://umu.diva-portal.org/smash/record.jsf?pid=diva2%3A753270&dswid=7746
Fredman, P., Ankre, R., & Chekalina, T., (2019). Friluftsliv 2018 – Nationell undersökning av svenska folkets friluftsvanor (No. 6887). Naturvårdsverket, Stockholm, Sweden.
Geurs, K. & Van Wee, B. (2004). Accessibility evaluation of land-use and transport strategies: review and research directions. Journal of Transport Geography, 12(2):127–140, 6 2004. doi: 10.1016/j.jtrangeo.2003.10.005. https://doi.org/10.1016/j.jtrangeo.2003.10.005
Pereira, Rafael H. M. & Herszenhut, Daniel. (2023). Introduction to urban accessibility: a practical guide with R. Ipea, Institute of Applied Economic Research.
Riksidrottsförbundet. (2011). Svenska folkets idrotts- och motionsvanor. Technical report, 6 2011. https://www.rf.se/download/18.7e76e6bd183a68d7b711504/1664975931750/Svenska%20folkets%20idrotts-%20och%20motionsvanor%202011.pdf
Links and further reading:
Surprised by Your Neighborhood’s Walkability Score? Don't Be. A cautionary tale of using indices.
Hoekman, R., Breedveld, K., Kraaykamp, G., 2016. A landscape of sport facilities in the Netherlands. International Journal of Sport Policy and Politics 8, 305–320.
Levinson, D., King, D., 2020. Transport Access Manual: A Guide for Measuring Connection between People and Places. Committee of the Transport Access Manual, University of Sydney, Sidney, Australia.

Jorge Gil
Jorge Gil is associate professor in Urban Analytics and Informatics at the Department of Architecture and Civil Engineering, Chalmers University of Technology, Sweden. His research focus is on the conceptualisation and development of integrated urban models for urban planning research and practice.

Susan Ruinaard
Susan is a master’s student in Engineering and Policy Analysis at the Faculty of Technology, Policy and Management, Delft University of Technology, and works with GIS and data analysis at Studio Bereikbaar, a consultancy firm on the intersection of mobility and urbanism in the Netherlands.